Image

Vegetable classification with Parallel CNN model

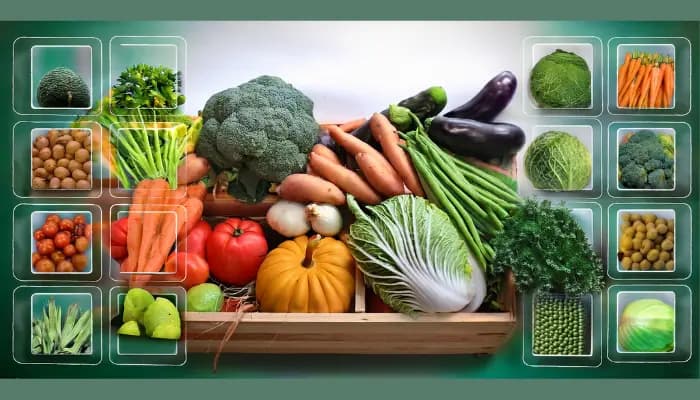
In today's technologically advanced world, accurately classifying vegetables is crucial across various sectors, including agriculture, food retail, and supply chain management. The demand for efficient and reliable methods to sort and identify vegetables has never been higher, and machine learning offers an innovative solution to this challenge. By automating the classification process, we can ensure consistency, reduce manual labor, and enhance overall quality control in the agricultural and food industries. This tutorial on "Vegetable Classifications" provides a comprehensive guide on leveraging machine learning techniques to classify different types of vegetables accurately. Automating this process can lead to numerous benefits, such as improved inventory management, reduced food waste, and better product presentation, while also contributing to smart farming solutions that boost productivity and sustainability. By mastering these techniques, you'll be well equipped to apply machine learning to various classification tasks, addressing real-world problems with cutting edge technology.

Explanation All Code

STEP 1:

You can mount your Google Drive in a Google Colab notebook with this piece of code. This creates it simple to see files saved in Google Drive in the Colab setting so that data can be changed, analyzed, and models can be trained.


Import the necessary packages.


This code sets up the necessary tools and layers to build, train, and evaluate a CNN model for image classification using TensorFlow and Keras.


Check GPU availability


This code checks for available GPUs, configures them to use memory dynamically (as needed), and returns the number of GPUs detected.


STEP 2:

Data processing


This block of code initializes variables for a TensorFlow data pipeline, setting the batch size, image dimensions, random seed, path to the dataset, and enabling automatic tuning of data loading performance.


This block of code creates a training dataset by loading and resizing images from a directory ({PATH}/train). The image_dataset_from_directory function resizes images to specified dimensions, batches them, and shuffles the dataset using a seed for randomization.


This block of code creates a testing dataset by loading and resizing images from a directory ({PATH}/test). The image_dataset_from_directory function resizes images, batches them, and maintains their original order (shuffle=False) for consistent evaluation.


This block of code creates a validation dataset by loading and resizing images from a directory ({PATH}/validation). The image_dataset_from_directory function resizes and batches the images, shuffling them (shuffle=True) with a seed to ensure random order for robust model evaluation.


Show class names


This code retrieves and displays the list of class names (labels) present in the training dataset (`train_data`). These class names correspond to the different categories of vegetables in your dataset.


Counting Unique Classes in the Dataset


This code calculates and displays the total number of unique classes (categories) in the dataset by determining the length of the `class_names` list. This gives you the number of different vegetable types that the model will classify.


STEP 3:

Plotting distributions


This plot_label_distribution function visualizes label distribution in a dataset using Plotly. It combines all labels into a single array, maps them to class names, and creates a DataFrame. Then, it uses Plotly's px.histogram to generate a count plot with distinct colors for each label, adding titles and labels before displaying the plot.


Show plot of train data distribution


This code calls the `plot_label_distribution` function, which creates a visual plot to show the distribution of labels (i.e., how many images belong to each vegetable class) within the `train_data` dataset. The plot helps you understand if your dataset is balanced or if there are any classes with significantly more or fewer images, which is important for model training.


Show plot of validation data distribution


This code generates a visual plot of the label distribution for the validation dataset (`val_data`) using the `plot_label_distribution` function. It shows how the images are distributed across the different vegetable classes in the validation set, helping to ensure that the validation data is balanced and representative of the training data.


Show plot of test data distribution


This code generates a visual plot of the label distribution for the test dataset (`test_data`) using the `plot_label_distribution` function. It displays how the images are distributed among the different vegetable classes in the test set, allowing you to assess the balance and representativeness of the test data for evaluating the model's performance.


Step 4:

Prepare dataset for training and evaluation


This block of code preprocesses train_data, test_data, and val_data by unbatching them first. For train_data and val_data, it caches, shuffles, re batches them with the specified batch size, and prefetches to optimize performance. Test_data is unbatched, re-batched without caching or shuffling, and prefetches for efficient loading during training and evaluation.


Plotting example images


This function, closestDivisors, finds and returns the two closest divisors of a given number n by starting from the square root of n and decrementing until it finds a divisor.


The plot_images function visualizes a batch of images from a dataset, defaulting to train_data. It calculates the grid layout by finding the closest divisors of the batch size for rows and columns. Then, it displays the images in a grid, sets each subplot title to the corresponding class name, and hides the axes for a cleaner view.


STEP 5:

Build Custom CNN model (Prepare layers)


This code defines a preprocessing step to resize images and normalize pixel values to a 0-1 range before feeding them into the model.


This block of code defines a sequential convolutional neural network (CNN) model, model_1, for image classification using TensorFlow and Keras. It consists of multiple convolutional layers with varying filter sizes and activations, interspersed with max pooling and batch normalization layers to reduce dimensions and normalize activations. A flattening layer converts the 2D feature maps into a 1D vector, followed by fully connected layers with ReLU activations, a dropout layer for regularization, and a softmax output layer for classifying images into num_classes categories.


This block of code defines two callbacks to enhance neural network training and prevent overfitting. The EarlyStopping callback monitors validation loss (val_loss) and stops training if it doesn't improve for 5 epochs, starting from the 3rd epoch, and restores the best weights. The ReduceLROnPlateau callback reduces the learning rate by 0.15 if val_loss doesn't improve for 2 consecutive epochs, with a minimum learning rate of 1e-10 and a min_delta of 0.0004, lowering the rate when no new minimum is observed.


This block of code defines custom metrics for precision, recall, and AUC, tailored for sparse categorical predictions by subclassing TensorFlow's metrics and overriding the update_state method to convert predicted probabilities to class indices using tf.argmax. It then compiles model_1 with these custom metrics, using the Adam optimizer and sparse categorical crossentropy loss. Finally, it trains the model for 40 epochs on the training data, with validation data and callbacks for early stopping and learning rate reduction, saving the training history in history_model_1.


This block of code displays a summary of model_1, providing an overview of its architecture, including the layers, output shapes, and the number of parameters for each layer and the entire model.


This block of code generates and displays a visual representation of model_1, including the shapes of the input and output tensors for each layer, with a resolution specified by dpi=75.


Build Parallel CNN Model


Normalization layer


This block of code creates a normalization layer that rescales input pixel values by dividing them by 255, effectively normalizing the pixel values from a range of 0-255 to a range of 0-1.


This block of code defines an input layer for a neural network with a specified shape (img_width, img_height, 3) and adds Gaussian noise with a standard deviation of 0.1 to the inputs to help regularize the model and improve its robustness.


First branch


This block of code defines the first branch of a neural network, beginning with a normalization layer, followed by convolutional layers with ReLU activations, batch normalization, and max pooling. These layers reduce spatial dimensions and increase feature map depth, extracting hierarchical features from the input data.


Second Branch


This block of code defines the second branch of a neural network, mirroring the first branch. It starts with a normalization layer and Gaussian noise, followed by alternating convolutional layers with ReLU activation, batch normalization, and max pooling, progressively extracting features from the input data.


Merging layers


This block of code concatenates the outputs of the two branches along the specified axis (axis=1) and then flattens the merged output into a 1D vector, preparing it for further dense layers in the neural network.


Output layers


This block of code defines the output layers of the neural network by first applying two dense layers with ReLU activations, followed by a dropout layer with a rate of 0.4 for regularization, and finally a dense layer with a softmax activation to produce the class probabilities for num_classes classification.


Creating model instance


This block of code creates a Keras model, model_2, by specifying input_layer as the input and output_layers as the output, effectively linking all the defined layers into a complete neural network architecture.


Compiling an optimizer


This block of code defines custom metrics for sparse categorical predictions by subclassing TensorFlow's Precision, Recall, and AUC metrics, overriding the update_state method to convert predicted probabilities to class indices using tf.argmax. It then compiles model_2 using the Adam optimizer with a 1e-4 learning rate and sparse categorical crossentropy loss, specifying custom metrics (SparseCategoricalAccuracy, SparseCategoricalPrecision, SparseCategoricalRecall, SparseCategoricalAUC) to monitor and improve the model's classification performance during training.


This block of code displays a summary of model_2, providing detailed information about its architecture, including each layer's type, output shape, and the number of parameters, along with the total number of parameters in the model.


This block of code defines two callbacks for training model_2: EarlyStopping to stop training if validation loss doesn't improve for 5 epochs and restore the best weights, and ReduceLROnPlateau to reduce the learning rate by 0.1 if validation loss doesn't improve for 2 consecutive epochs, with a minimum learning rate of 1e-10 and an improvement threshold of 0.0004.


This block of code trains model_2 for up to 30 epochs using train_data and val_data with a specified batch_size, employing early_stopping and reduce_lr callbacks to halt training if validation loss stops improving and adjust the learning rate as needed, with progress displayed.


This block of code generates and displays a visual representation of model_2, including the shapes of the input and output tensors for each layer, with a resolution specified by dpi=75.


STEP 6:

Plotting Matrices


The plot_metrics function extracts and plots training and validation metrics from a model's training history, displaying them in a 2x3 grid. It then evaluates the model on a test dataset, prints the test metrics and the number of misclassified images, and returns the test metrics for further analysis.


This block of code calls the plot_metrics function to visualize the training history of model_1, evaluates model_1 on the test_data, and stores the resulting test metrics into the corresponding variables.


This block of code defines the get_actual_predicted_labels function, which retrieves actual labels from an unbatched dataset, generates predictions using a model, stacks the actual labels, converts predicted probabilities to class indices with tf.argmax, and returns both the actual and predicted labels.


This function, plot_confusion_matrix, generates and visualizes a confusion matrix using Seaborn's heatmap for actual versus predicted labels, customizing the plot with titles, labels, and class names, and adjusting the figure size and font scale for better readability.


Plot Confusion Matrix for Custom CNN Model


This block of code collects true labels and model predictions of parallel CNN model for the validation dataset, converts them to arrays, and prints a detailed classification report using classification_report with four decimal places, providing metrics like precision, recall, and F1-score for each class.


Plot Confusion Matrix for Parallel CNN Model


This block of code evaluates the combined predictions of model_1 and model_2 on a validation dataset by averaging their predicted probabilities and comparing the combined predictions to the true labels. It then generates and prints a detailed classification report, including precision, recall, and F1-score metrics.


This block of code calculates the precision and recall for each class in a multi-class classification problem using a confusion matrix. It computes true positives (TP) from the diagonal of the matrix, and then derives false positives (FP) and false negatives (FN) to calculate precision and recall for each class.


This block of code calculates the precision and recall for each class in the test dataset using the calculate_classification_metrics function with the actual and predicted labels, then prints out the resulting precision and recall values for the model.


STEP 7:

Visualizing Predictions


This block of code iterates through the test_data dataset, storing each batch in a list, then extracts and appends individual images and labels from these batches into test_images and test_labels lists respectively, finally converting these lists into numpy arrays.


This block of code converts a list of predicted probability distributions (y_pred) into a list of predicted class labels by finding the index of the maximum probability for each prediction.


This block of code iterates through test images and their predicted and true labels, appending incorrectly classified images to false_class and correctly classified images to true_class, along with their predicted and true labels.


This block of code evaluates the combined predictions of model_1 and model_2 on a validation dataset by averaging their predicted probabilities and comparing them to the true labels. It then generates and prints a detailed classification report with precision, recall, and F1-score metrics.


Visualizing False Predictions


This code visualizes the misclassified images (`false_class`) in a grid layout with 4 columns, displaying both the predicted and true labels for each image.


Visualizing True Predictions


This code visualizes the correctly classified images (`true_class`) in a grid layout with 4 columns, displaying both the predicted and true labels for each image.


Conclusion


In conclusion, the ability to accurately classify vegetables using machine learning represents a significant advancement in the fields of agriculture, food retail, and supply chain management. Throughout this tutorial, we've explored the essential techniques and methodologies required to develop a robust vegetable classification system. By automating the classification process, we can achieve greater consistency, reduce manual labor, and improve overall quality control, ultimately leading to better inventory management, reduced food waste, and enhanced product presentation. The skills and knowledge gained from this tutorial not only empower you to tackle vegetable classification but also equip you with the tools to address a wide range of classification challenges across various industries. As you continue to refine and expand your machine learning capabilities, you'll be better prepared to develop innovative solutions that drive efficiency and sustainability.


We hope this tutorial has inspired you to explore the vast potential of machine learning and its applications in solving real-world problems. Thank you for joining us on this journey, and we look forward to seeing your future contributions to the field.

Code Editor