- An Introduction to Machine Learning | The Complete Guide
- Data Preprocessing for Machine Learning | Apply All the Steps in Python
- Regression
- Learn Simple Linear Regression in the Hard Way(with Python Code)
- Multiple Linear Regression in Python (The Ultimate Guide)
- Polynomial Regression in Two Minutes (with Python Code)
- Support Vector Regression Made Easy(with Python Code)
- Decision Tree Regression Made Easy (with Python Code)
- Random Forest Regression in 4 Steps(with Python Code)
- 4 Best Metrics for Evaluating Regression Model Performance
- Classification
- A Beginners Guide to Logistic Regression(with Example Python Code)
- K-Nearest Neighbor in 4 Steps(Code with Python & R)
- Support Vector Machine(SVM) Made Easy with Python
- Kernel SVM for Dummies(with Python Code)
- Naive Bayes Classification Just in 3 Steps(with Python Code)
- Decision Tree Classification for Dummies(with Python Code)
- Random forest Classification
- Evaluating Classification Model performance
- A Simple Explanation of K-means Clustering in Python
- Hierarchical Clustering
- Association Rule Learning | Apriori
- Eclat Intuition
- Reinforcement Learning in Machine Learning
- Upper Confidence Bound (UCB) Algorithm: Solving the Multi-Armed Bandit Problem
- Thompson Sampling Intuition
- Artificial Neural Networks
- Natural Language Processing
- Deep Learning
- Principal Component Analysis
- Linear Discriminant Analysis (LDA)
- Kernel PCA
- Model Selection & Boosting
- K-fold Cross Validation in Python | Master this State of the Art Model Evaluation Technique
- XGBoost
- Convolution Neural Network
- Dimensionality Reduction
A Simple Explanation of K-means Clustering in Python | Machine Learning

In this tutorial, we are going to understand K-means Clustering and implement the algorithm in Python
What is Clustering?
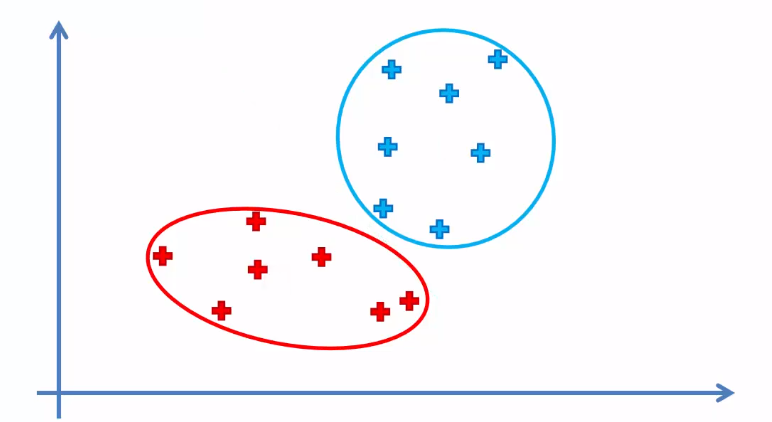
Clustering is an unsupervised learning algorithm. A cluster refers to groups of aggregated data points because of certain similarities among them. Clustering algorithms group the data points without referring to known or labeled outcomes.
There are commonly two types of clustering algorithms, namely K-means Clustering and Hierarchical Clustering. In this tutorial, we are going to understand and implement the simplest one of them- the K-means clustering.
What is K-means Clustering?
This algorithm categorizes data points into a predefined number of groups K, where each data point belongs to the group or cluster with the nearest mean. Data points are clustered based on similarities in their features. The algorithm works iteratively to assign each data point to one of the K groups in such a way that the distance(i.e. Euclidian or Manhattan) between the centroid(i.e. the center of the cluster) of that group and the data point be small. The algorithm produces exactly K different clusters of the greatest possible distinction.

How K-means Clustering Works?
K-means Clustering takes an iterative approach to perform the clustering task. The working steps of this algorithm are as follows-
Step 1: Choose the number K of clusters.
Step 2: Select at random K points, the centroids(not necessarily from our dataset).
Step 3: Assign each data point to the closest centroid based on euclidian or manhattan distance. That forms K clusters.
Step 4: Compute and place the new centroid of each cluster.
Step 5: Reassign each data point to the new closest centroid. If any reassignment took place, go to step 4.
It stops creating or optimizing clusters if either the centroids have stabilized meaning no new reassignment of data points takes place or the algorithm reaches the defined number of iterations.
Choosing The Optimal Number of Clusters
The value of k is very crucial for optimal outcomes from the algorithm. There are several techniques to choose the optimal value for k including-
- Cross-Validation,
- Silhouette Method
- G-means Algorithm
- Elbow Method
Here we will implement the elbow method to find the optimal value for k.
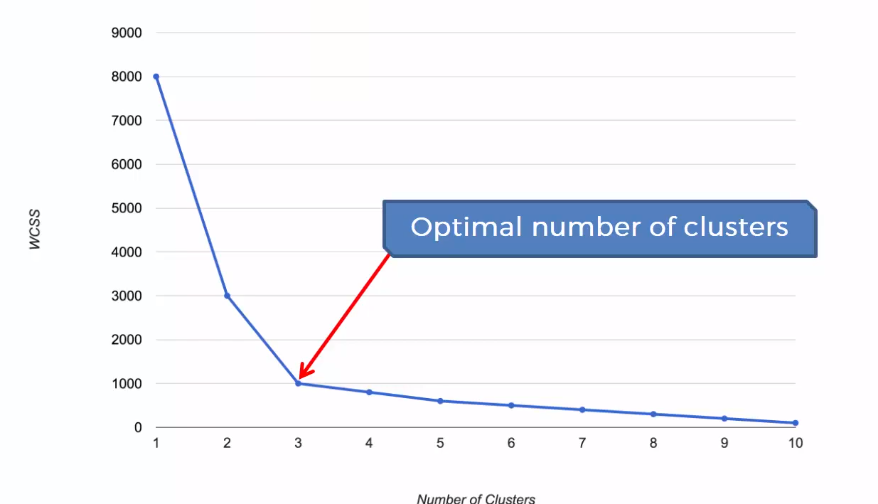
As the K-means algorithm works by taking the distance between the centroid and data points, we can intuitively understand that the higher number of clusters will reduce the distances among the points. For that, we plot the number of clusters k and the Within Cluster Sum of Squares(WCSS). The plot would look like an elbow, as with an increasing number of clusters after a certain point, the WCSS starts to stabilize and tends to go parallel with the horizontal axis. So we will take that point after which the plot tends to become similar.

The Within Cluster Sum of Squares(WCSS) is used to calculate the variance in the data points. The goal of the algorithm is to minimize this value.

Implementing K-means Clustering in Python
Now, we will implement the above idea in Python using the sklearn library.
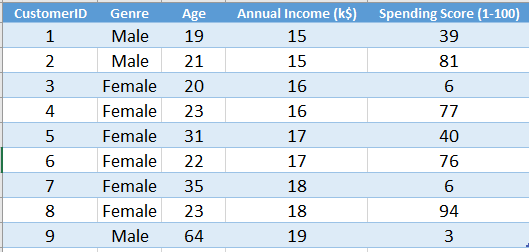
Let's assume we have a dataset(Mall_Customer.csv) where the details of all customers in a mail are recorded. The features are the genre of the customers(Male or Female), their age, annual income and spending score on a scale of 1 to 100. The data are unlabeled that is there is no output column like in a regression or classification dataset. So, the problem falls in the unsupervised class.
Now, our task is to find a number of groups among the customers according to their annual income and spending score. Let's apply K-means clustering and see what happens.
 .
.
You can download the whole dataset form here.
First of all, we will import essential libraries. You will get the code in Google Colab also.
import numpy as np
import matplotlib.pyplot as plt
import pandas as pd
Now, we will import the dataset to our program. Then we will take those features that will effective for our clustering. Here we are interested in the annual income and spending score. So we will take them to our program.
dataset = pd.read_csv('Mall_Customers.csv')
X = dataset.iloc[:, [3, 4]].values
We need to find the number of cluseter or k. For this we will plot a elbow method graph to find the optimal value for k.
# Using the elbow method to find the optimal number of clusters
from sklearn.cluster import KMeans
wcss = []
for i in range(1, 11):
    kmeans = KMeans(n_clusters = i, init = 'k-means++', random_state = 42)
    kmeans.fit(X)
    wcss.append(kmeans.inertia_)
plt.plot(range(1, 11), wcss)
plt.title('The Elbow Method')
plt.xlabel('Number of clusters')
plt.ylabel('WCSS')
plt.show()
Note: Here, the parameter init is set to k-means++ to avoid the random initialization trap.
Let's see the graph
.png)
From the above graph, we can see that the optimal value for k is 5(the point where the clustering going parallel with the increasing number of clusters).
# Fitting K-Means to the dataset
kmeans = KMeans(n_clusters = 5, init = 'k-means++', random_state = 42)
y_kmeans = kmeans.fit_predict(X)
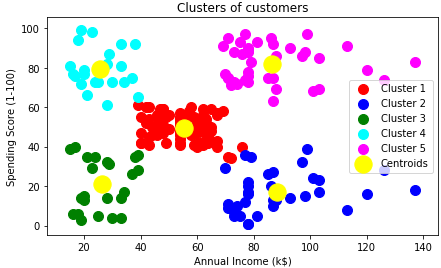
Well, we will come to the coolest part of our algorithm. Now we will visualize the outcomes to see what it has done.

We can see that the data points are grouped in 5 clusters as we defined in the algorithm. This algorithm is one of the simplest clustering algorithms and has various business uses.
Uses of K-means Clustering
Clustering is widely used in many domains from business to biology. Here are some cool applications of K-means clustering-
- Market Research Clustering is used to find purchasing patterns among consumers and group them into distinct clusters. The marketer can take different sales strategy according to the groups.
- Website Traffic Analysis Clustering helps to segment the traffic of a website into various classes. This helps to improve the content of a website.
- Grouping Search Result Search engines use cluster analysis to group all the relevant information for a keyword is searched.
- Image Compression In image processing, clustering is used to group similar pixels and make them into groups for compressing the image.
- Gene Segmentation In the field of biology, clustering is useful to find similar genes according to their behavior.
- Anomaly Detection Clustering is widely used to detect fraud using credit card
- Recommendation Engines Clustering is used to find the certain behavioral patterns of users and then the patterns are then used to build recommendation engines
Choosing the Distance Metric for Clustering
There are many distance metrics that can be used with clustering algorithms. It depends on the type of data you are using. The default distance metric for sklearn clustering is the Euclidian distance. Here are some points about the distance metrics when to use them-
- Euclidian Distance: Euclidian distance works well with clusters that have a flat geometrical shape. According to Sklearn documentation, the most used distance metric for flat geometrical clusters is Euclidian distance.
- Manhattan Distance: Manhattan distance is an alternative to Euclidian distance and works somehow similar on flat geometrical clusters.
- Graph Distance: For non-flat geometrical shapes, graph distance is the best. You can apply metrics like k-nearest neighbor graphs to do so.
- Mahalonbish Distance: This distance metric is used in the case of flat geometry and Gaussian mixture models.
- Correlation Based Distance: This type of distance metrics are often most useful in cases such as gene expression data analysis.
What is the Time Complexity of K-means Clustering?
K-means clustering falls in the class of NP-hard problems. So the time complexity is polynomial.
In most cases, the worst complexity for K-means clustering is O(n^2 * log(n))
Where n is the number of points.
More precisely, the complexity should be expressed as- O(ndk)
Where,
n=number of data points
d = dimension of the data
k = number of clusters
Research is going on to implement K-means with less time complexity such as this, where the time complexity is reduced to O(n) using cluster shifting.
Why K-means Clustering is a Non-Deterministic Algorithm?
K-means clustering gets non-deterministic natures due to its random selection of data points as initial centroids. For this randomness, you will get different results on the same instance of data set for different execution.
This nature limits the applicability of K-means clustering in areas such as cancer prediction using gene expression data. The result can be misinterpreted when comparing with other models.
But some measures can be taken such as fixing the choice of initial centroid to decrease the randomness and making the model close to deterministic.
Final Words
In this tutorial, I have tried to present and explain all the basic concepts of K-means clustering to you. In summary, the key takeaways are-
- What K-means clustering is and how it works
- Python implementation of the idea to solve a business problem
- Understanding the nature of the algorithm and choosing the best distance metric
- Learning the uses of K-means clustering
Hope the tutorial helped you to understand the concepts.
What difficulties you faced or new things discovered when doing K-means clustering?
Please let us know in the comments.
Happy Machine Learning!