- An Introduction to Machine Learning | The Complete Guide
- Data Preprocessing for Machine Learning | Apply All the Steps in Python
- Regression
- Learn Simple Linear Regression in the Hard Way(with Python Code)
- Multiple Linear Regression in Python (The Ultimate Guide)
- Polynomial Regression in Two Minutes (with Python Code)
- Support Vector Regression Made Easy(with Python Code)
- Decision Tree Regression Made Easy (with Python Code)
- Random Forest Regression in 4 Steps(with Python Code)
- 4 Best Metrics for Evaluating Regression Model Performance
- Classification
- A Beginners Guide to Logistic Regression(with Example Python Code)
- K-Nearest Neighbor in 4 Steps(Code with Python & R)
- Support Vector Machine(SVM) Made Easy with Python
- Kernel SVM for Dummies(with Python Code)
- Naive Bayes Classification Just in 3 Steps(with Python Code)
- Decision Tree Classification for Dummies(with Python Code)
- Random forest Classification
- Evaluating Classification Model performance
- A Simple Explanation of K-means Clustering in Python
- Hierarchical Clustering
- Association Rule Learning | Apriori
- Eclat Intuition
- Reinforcement Learning in Machine Learning
- Upper Confidence Bound (UCB) Algorithm: Solving the Multi-Armed Bandit Problem
- Thompson Sampling Intuition
- Artificial Neural Networks
- Natural Language Processing
- Deep Learning
- Principal Component Analysis
- Linear Discriminant Analysis (LDA)
- Kernel PCA
- Model Selection & Boosting
- K-fold Cross Validation in Python | Master this State of the Art Model Evaluation Technique
- XGBoost
- Convolution Neural Network
- Dimensionality Reduction
Support Vector Regression Made Easy(with Python Code) | Machine Learning

Probably you haven't heard much about Support Vector Regression aka SVR. I don't know why this absolutely powerful regression algorithm has scarcity in uses. There are not good tutorials on this algorithm. I had to search a lot to understand the concepts while working with this algorithm for my project. Then I decided to prepare a good tutorial on this algorithm and here it is! In this article, we are going to understand Support Vector Regression. Then we will implement it using Python.
Support Vector Regression uses the idea of a Support Vector Machine aka SVM to do regression. Let's first understand SVM before diving into SVR
What is a Support Vector Machine?
Support Vector Machine is a discriminative algorithm that tries to find the optimal hyperplane that distinctly classifies the data points in N-dimensional space(N - the number of features). In a two-dimensional space, a hyperplane is a line that optimally divides the data points into two different classes. In a higher-dimensional space, the hyperplane would have a different shape rather than a line.
Here how it works. Let's assume we have data points distributed in a two-dimensional space like the following-
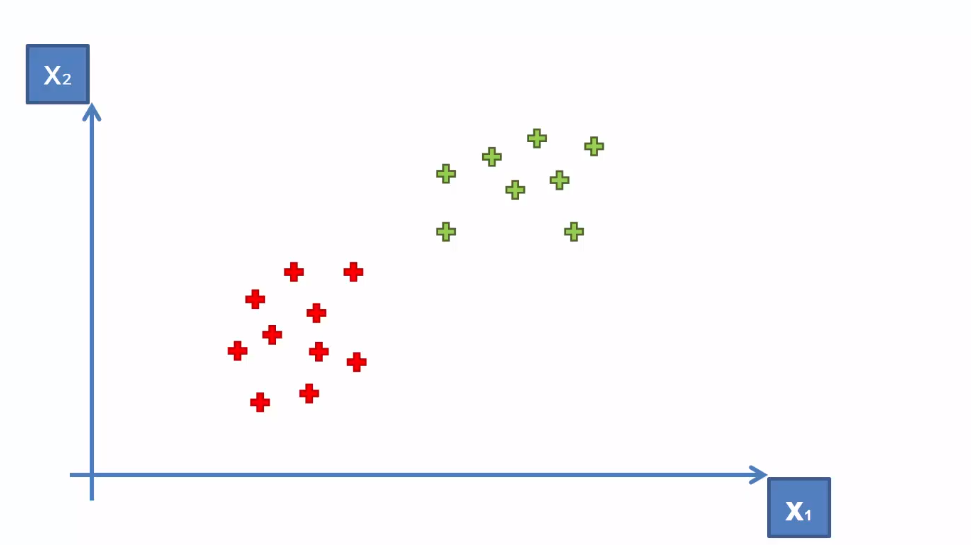
SVM will try to find an optimal hyperplane. Here optimal refers to the line that can most equally divide the data. In other words, the line which will separate the two classes in a way that each class possibly contains the highest number of data points of its kind. After applying SVM to this data, the figure will look like the following-
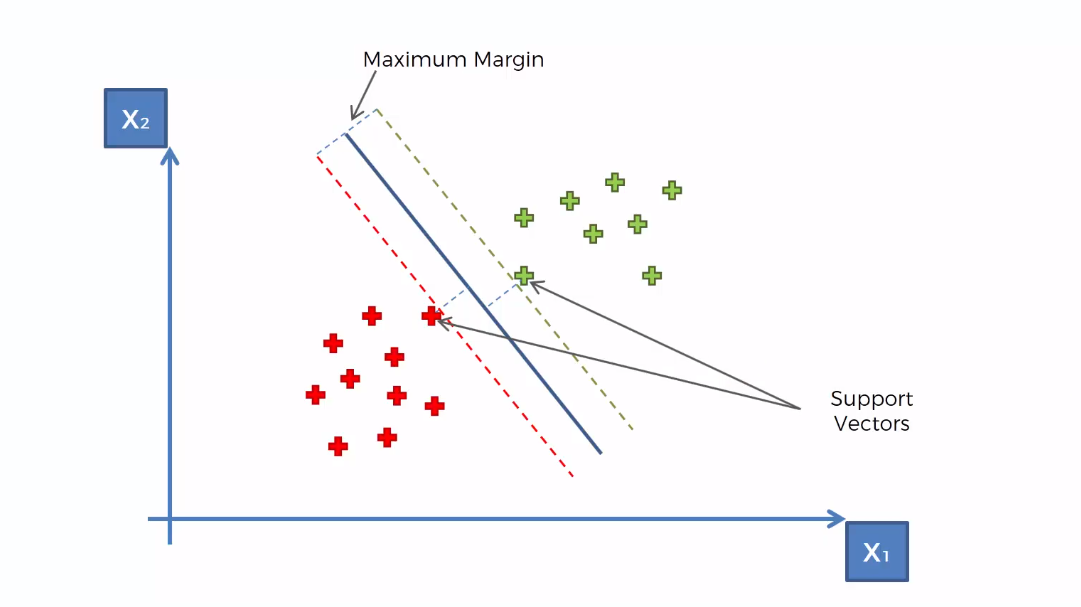
In search of an optimal hyperplane, the SVM tries to find boundary data points or support vectors. The support vectors are chosen in such a way that the hyperplane will be at a possible maximum distance from both support vectors.
You may ask what is a support vector in a support vector machine?
Support vectors are those two data points supporting the decision boundary(the data points which have the maximum margin from the hyperplane). An SVM always tries to those two data points from different classes that are the closest to each other. These support vectors are the keys to draw an optimal hyperplane by SVM. In SVM, the set of input and output data are treated as vectors. This is because when the data is a higher-dimensional space(more than two dimensions), the classes cannot be represented as single data points, so they must be represented as vectors. And that's how it's got the name "Support Vector Machine".
I think you got the basic idea of SVM. Now, we can proceed to SVR-
Support Vector Regression Intuition
Support Vector Regression(SVR) is quite different than other Regression models. It uses the Support Vector Machine(SVM, a classification algorithm) algorithm to predict a continuous variable. While other linear regression models try to minimize the error between the predicted and the actual value, Support Vector Regression tries to fit the best line within a predefined or threshold error value. What SVR does in this sense, tries to classify all the prediction lines in two types, ones that pass through the error boundary( space separated by two parallel lines) and ones that don’t. Those lines which do not pass the error boundary are not considered as the difference between the predicted value and the actual value has exceeded the error threshold, 𝞮(epsilon). The lines that pass, are considered for a potential support vector to predict the value of an unknown. The following illustration will help you to grab this concept.
.
Before analyzing the above illustration, first, understand some crucial definitions-
- Kernel is a function that is used to map lower-dimensional data points into higher dimensional data points. As SVR performs linear regression in a higher dimension, this function is crucial. There are many types of kernels such as Polynomial Kernel, Gaussian Kernel, Sigmoid Kernel, etc.
- Hyper Plane In Support Vector Machine, a hyperplane is a line used to separate two data classes in a higher dimension than the actual dimension. In SVR, a hyperplane is a line that is used to predict continuous value.
- Boundary Line Two parallel lines drawn to the two sides of Support Vector with the error threshold value, 𝞮(epsilon) are known as the boundary line. These lines create a margin between the data points.
From the above illustration, you clearly can understand the concept. The boundary is trying to fit as many instances as possible without violating the margin. The width of the boundary is controlled by the error threshold 𝞮(epsilon). In classification, the support vector X is used to define the hyperplane that separated the two different classes. Here, these vectors are used to perform linear regression.
How Does Support Vector Regression Work?

Let's do these steps one by one
First, choose a kernel, let's take the Gaussian kernel.
Now we come to the Correlation Matrix
In the equation above, we are evaluating our kernel for all pairs of points in our training set and adding the regularizer resulting in the matrix.
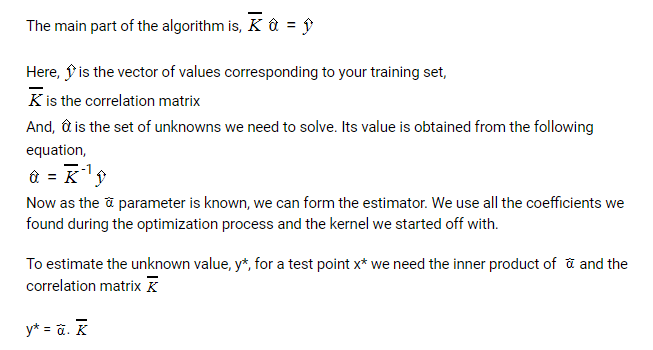
Then we estimate the elements of the coefficient matrix by the following:
That's all! These crucial steps are everything you need to understand and perform support vector regression.
Support Vector Regression in Python
Pythons' Scikit-Learn module provides all the functions to implement SVR. All we need to take a data set and prepare it to fit an SVR model.
For this tutorial, we choose a data set that provides the salary of employees along with their position and level. Let's have a look at the data-

You can download the dataset from here.
This dataset contains the position and level of some employees and according to this level, the salary is calculated. Let's check the graph of this dataset
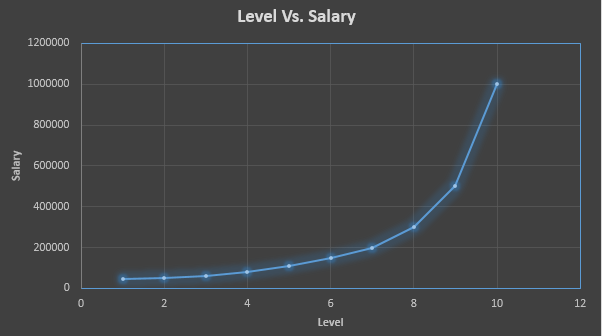
The graph shows that the data is non-linear. Now, what if we want to learn the salary for a level of 6.5. What would be that? To predict that, we will implement Support Vector Regression. You will get full code in Google Colab.
First of all, include the essential libraries
# Importing the libraries
import numpy as np
import matplotlib.pyplot as plt
import pandas as pd
Let's import the dataset and make the feature matrix and the dependent variable vector
# Importing the dataset
dataset = pd.read_csv('Position_Salaries.csv')
X = dataset.iloc[:, 1:2].values
y = dataset.iloc[:, 2].values
Now, we need to feature scale the data
# Feature Scaling
from sklearn.preprocessing import StandardScaler
sc_X = StandardScaler()
sc_y = StandardScaler()
X = sc_X.fit_transform(X)
y = sc_y.fit_transform(y.reshape(-1, 1))
Now, we need to feature scale the data
# Fitting SVR to the dataset
from sklearn.svm import SVR
regressor = SVR(kernel = 'rbf')
regressor.fit(X, y)
Fit the SVR algorithm to the dataset Let's predict the result
# Predicting a new result
y_pred = regressor.predict([[6.5]])
y_pred = sc_y.inverse_transform(y_pred)
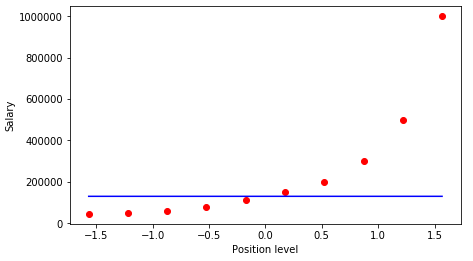
Finally, we can now visualize what our model has done!
# Visualising the SVR results
plt.scatter(X, y, color = 'red')
plt.plot(X, regressor.predict(X), color = 'blue')
plt.xlabel('Position level')
plt.ylabel('Salary')
plt.show()
Let's have a look at the graph
Multi-output Support Vector Regression in Python
In our example, we took a data set with a single output variable. What if you need to find multiple outputs? Suppose we add a new attribute named Job Satisfaction into our data set which will describe how much satisfaction the employees get in an inclusive range of one to ten. Now our model would have to predict two outputs. Can we do that with our existing model?
The answer is no. SVR is inherently suitable to work with a single output problem. But sometimes you need to work with data containing multiple outputs(like the above example). In Scikit-learn there is a class named MultiOutputRegressor which can be used as a base regressor that will take an SVR to perform a multi-output regression task. The trick here is to train a separate SVR for each output. If there is any correlation between the target outputs, it will not consider that correlation. Hence, some issues may come out when your output variables hold correlations among them. In that case, you should use decision tree-based regression algorithms. Decision trees inherently handle multiple outputs and may perform better than SVR.
Let's talk about some applications of support vector regression. Though SVR sounds like just a regression algorithm, it has great uses in many areas especially in time series forecasting for stock prices.
Support Vector Regression for Time-series Forecasting
Recall the idea of SVR. Here, you give a set of input vectors and defined an output. The SVR then fits a model and tries to learn from those input vectors and finally predicts the response for a given new input vector. While working with time series data like stock prices, you need to determine which will be the "feature vector".
This is because time series data is time-dependent i.e. there will be a lot of past values and you can not take everything as feature vectors. For example, you have a stock price data set that contains the prices of a single stock from the previous six months. Now, based on this data you want to forecast the future price of the stock.
Here, you have to transform the past data to build some feature vectors. There are many ways you can do this i.e. averaging the past one month's prices or the current price of the stock divided by the moving average. This will minimize the input vectors and make it easier for the SVR to fit them. SVR features are unordered x-y pairs, so you can not get a model that considers time order. If you want to maintain the time order, you can build separate SVRs i.e. one for the past 10 days, one for the past 1 month, etc. and then take the average of all the predictions and forecast the values.
Advantages and Disadvantages of Support Vector Regression
There are some key benefits to choose a support vector machine for regression tasks. There are some drawbacks as well. Let's talk about them-
The key advantages are-
- SVM works really well with high-dimensional data. If your data is in higher dimensions, it is wise to use SVR.
- For data with a clear margin of separations, SVM works relatively well.
- When data has more features than the number of observations, SVM is one of the best algorithms to use.
- As a discriminative model, it need not to memorize anything about data. Therefore, it is memory efficient.
Some drawbacks are-
- It is a bad option when the data has no clear margin of separation i.e. the target class contains overlapping data points.
- It does not work well with large data sets.
- For being a discriminative model, it separates the data points below and above a hyperplane. So, you will not get any probabilistic explanation of the output.
- It is hard to understand and interpret SVM as its underlying structure is quite complex.
Support Vector Machine Vs. Support Vector Regression
We discussed at the beginning that supports vector regression uses the idea of a support vector machine, a discriminative classifier actually, to perform regression. In a sense of operative nature, they are different. SVM performs classification where SVR performs regression. That's the basic difference between an SVM and an SVR. Are there other differences?
Well, yes. The differences lie in their optimization functions. The optimization function for an SVM is-

While SVR uses a slightly different optimization function-

Final Thoughts
In the tutorial, I tried to explain to you all the major aspects of support vector regression. The key takeaways of the tutorial are-
- Understanding what a Support Vector Machine is.
- The Intuition behind Support Vector Regression and implementing it in Python.
- The major uses of SVR and the advantages and disadvantages of using it.
Hope you got a clear idea about the topic. If you have any questions in mind about the concepts, please let me know in the comments. Your feedback will help me to make it better.
Happy Machine Learning!